Nitrogen dioxide and ozone in Hawaii, 2015–2020 Completed
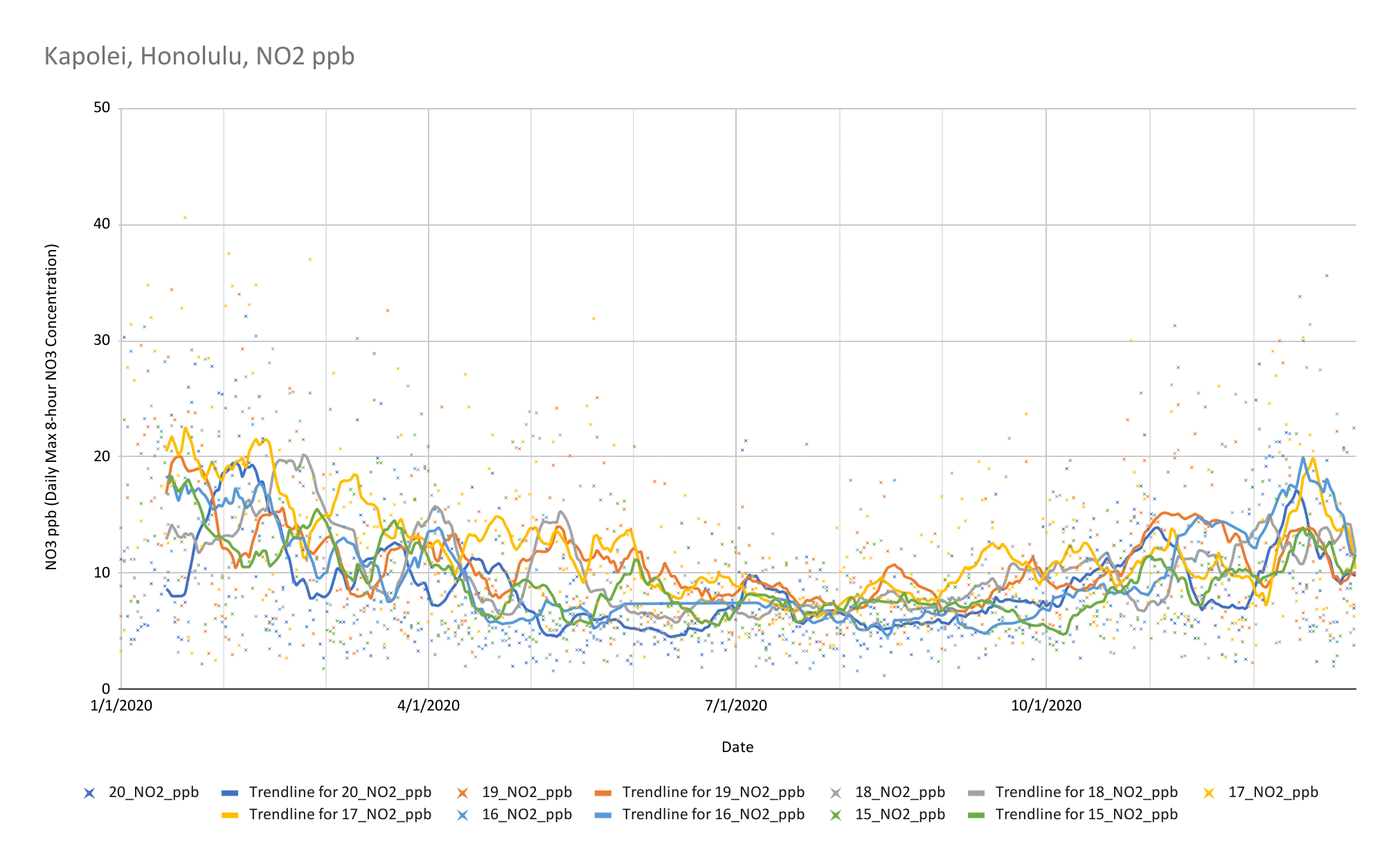
Throughout the months, each year’s trendline generally fluctuated between 5 and around 23 ppb, with noticeable spikes and valleys. Hawaii has lower NO₂ levels in general due to lower population density and limited industrial activity. Here, every year’s trendline had erratic amounts of NO₂ in the early parts of each year but then progressed to smooth out towards the summer and back to erraticness towards the end of the year. Comparing 2020 to previous years, the NO₂ concentrations in 2020 can be seen to be around the lowest in the first half of the year but then increase towards the other half of the year. In the lockdown period that occurred from March 25th to May 31st in 2020, there are dips that can be seen that dive lower than concentrations compared to the other years, then maintain their lowest concentration in May until right before July.
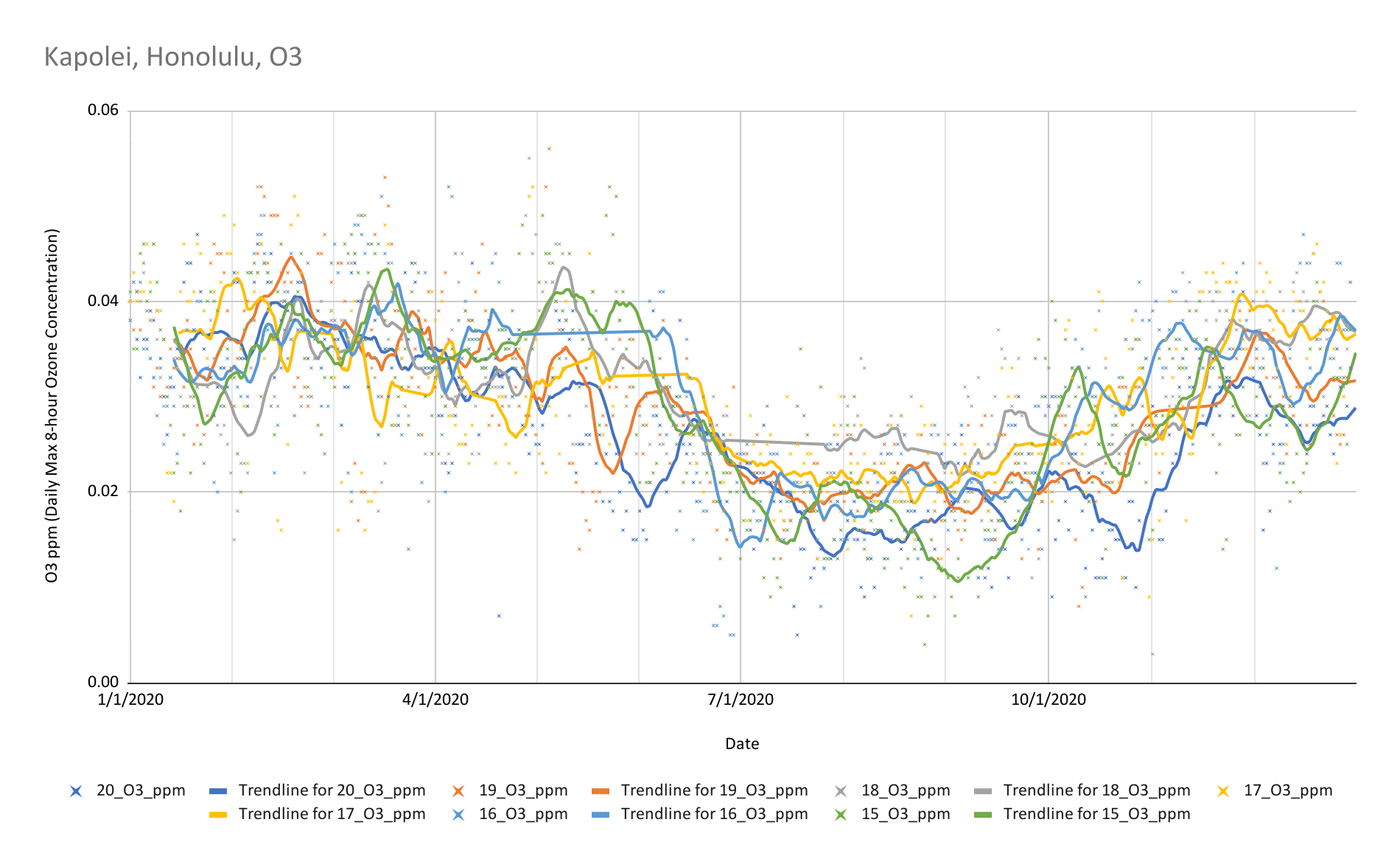
Across the graphs, general O₃ concentrations ranged from 0.01 to 0.045 ppm, with a sudden dip observed in the summer months that starts in June and reaches its absolute minimum around August before beginning to increase in September. With the bright blue line representing the year 2020, no observable trend can be seen in the early quarter of the year, blending in just like the other years before that. However, in June, there was a sudden dip in O₃ levels, then continuing to maintain its lowest levels (besides the valley observed in 2016 in September) all the way until the year’s end. Since there was still a general declining trend in June in all of the 5 years, a possible explanation would be due to La Niña-like cooling structures in the equatorial Pacific, which weaken ozone-rich air from Eurasia towards Hawaii. During the lockdown period that occurred in Hawaii from March 25th to May 31st, there are not any evident observations of a decrease in ozone levels, but only in the summer months was the dip much deeper as compared to the other years. This could be due to a late reaction to the lockdown, while it could also be due to Hurricane Douglas affecting wind trajectories and atmospheric conditions.
| 2020 | 2019 | 2019–2015 | |
|---|---|---|---|
| NO₂ average concentration ppb during the lockdown | 7.08358 | 11.2824 | 9.96801 |
| Percent change compare to the lockdown | -37.2% | -28.9% | |
| O₃ average concentration ppm during the lockdown | 0.0292 | 0.0315 | 0.0341 |
| Percent change compare to the lockdown | -7.3% | -14.3% |
Lockdown in Hawaii from March 25th, 2020, to May 31st, 2020.
After double-checking the average for all the years, the period that the lockdown occurred in 2020 still remains the lowest when compared to all the other years.
NO₂
2020 = 7.08358
2019 = 11.2824
2018 = 10.2603
2017 = 12.2409
2016 = 7.88494
2015 = 8.20152
AVG = 9.96801
O₃
2020 = 0.0292
2019 = 0.0315
2018 = 0.0342
2017 = 0.0310
2016 = 0.0361
2015 = 0.0376
AVG = 0.0341
On the graphs during the COVID lockdown, there is not a visible and apparent decrease of NO₂ as compared to the other years. On data, however, it states otherwise, with a -37.9% decrease compared to 2019 and a -28.9% decrease of NO₂ concentrations in comparison with the other years. Likewise for O₃, though the graph does not indicate a clear decrease during the COVID lockdown, the O₃ concentration for that period is less than both in 2019 and the other years, with a -7.3% decrease compared to 2019 and a -14.3% decrease compared to the previous years.